1
Open your brokerage account
Your investment account is established in your name with an available brokerage provider.

Open and fund a brokerage account in your own name. Choose a SAMA portfolio, connect it to our automated trading strategies, and monitor your investment through your personal portal.
FY27 YTD
Returns
View Report
Multi asset
Portfolio
View Instruments
Learn everything about
Automated Algorithmic Trading
Understand the full investment process in four straightforward steps—before portfolios, returns, or technical terminology.
Your investment account is established in your name with an available brokerage provider.
Your capital is deposited into your own brokerage account—not transferred into a general SAMA account.
You select an automated trading portfolio based on your objectives and risk tolerance.
Track performance, activity, and portfolio of each individual bots that work on multiple strategies.
Performance-based fee on profits only
SAMA earns through automated revenue sharing—a performance-based arrangement where we only receive a share when your account generates profits. There is no charge on losses, so our incentives stay aligned with yours.
The split depends on how you invest. Fees apply to realized profits only; contact SAMA for current terms and eligibility.
Via your broker
Connect your existing brokerage account and share profits on SAMA-managed performance.
Direct with SAMA
Invest through SAMA's managed-account framework with consolidated onboarding and reporting.
The technical structure used to connect your account is known as a PAMM account. It allows trading instructions to be applied across participating investor accounts while each investor retains ownership of their individual capital.
You keep custody. SAMA's automated systems execute through the connection—you do not transfer capital into a pooled SAMA account.
Each investment is secured in a personal brokerage account on a regulated broker with custodianship of the world's leading banks.
Investors have full access to their accounts and can fund, withdraw or manage their capital at any time.
Every is connected through a (Percentage Allocation Management Module) structure.
This allows our automated systems to execute trades on your behalf while you maintain full ownership and control of your capital.
We currently deploy 17 Automated Trading Machines across multiple asset classes and markets, designed to adapt to changing conditions and pursue consistent performance.
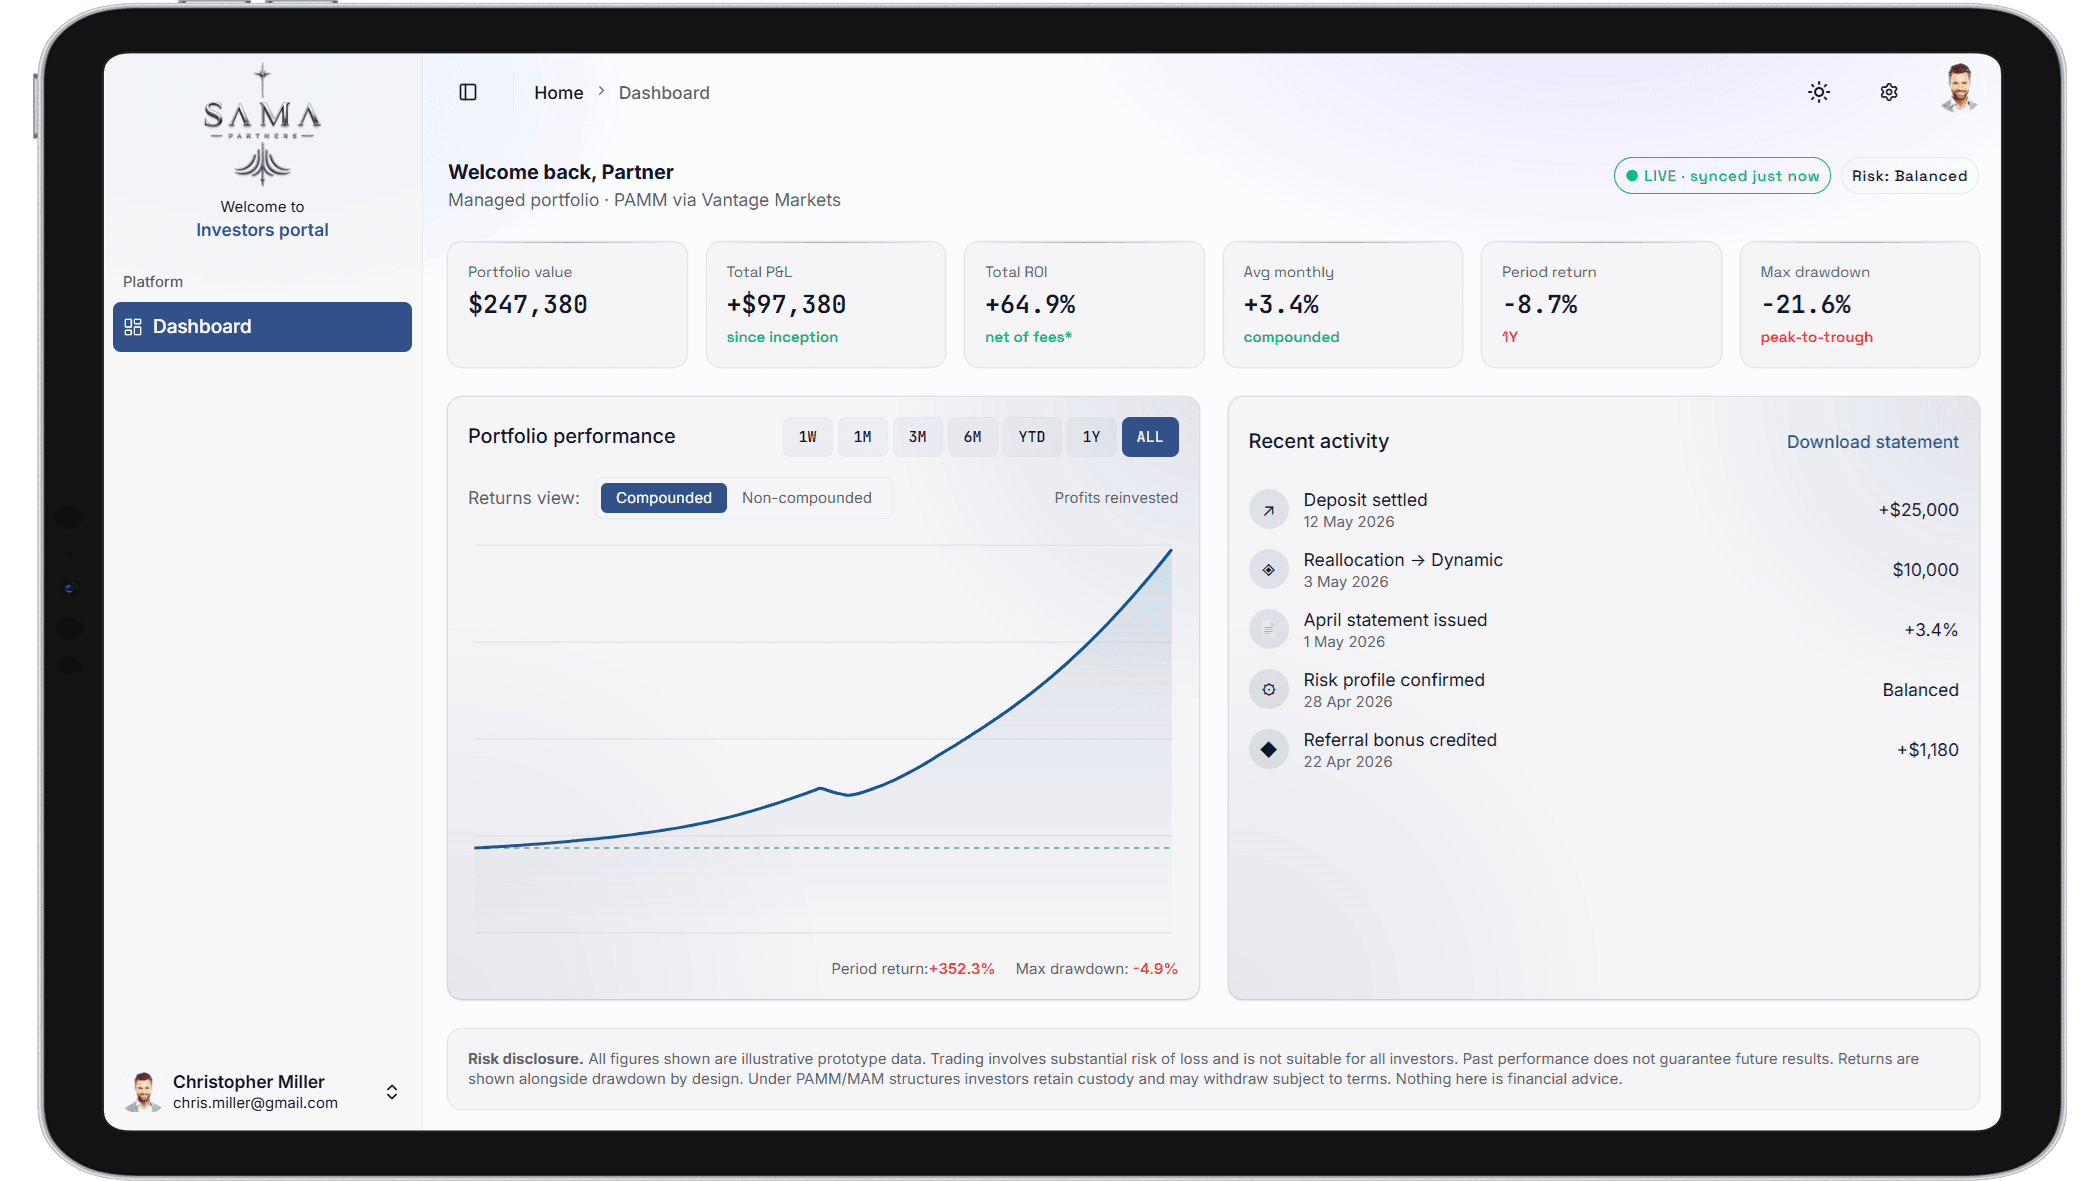
You have 24/7 access to your Personal Investment Portal, where you can monitor live performance, track positions, and review real-time activity as it happens.
Two automated trading portfolios with different objectives and risk profiles. Review the same categories side by side before exploring verified performance.
ATM Portfolio 1
Capital-focused strategy
Historically, the portfolio produced a total gain of 40.77% during the displayed period. Its largest peak-to-trough decline during that period was 15.81%.
On a $10,000 account, a 15.81% decline would represent a temporary reduction of approximately $1,581 from a previous account peak.
ATM Portfolio 2
Higher-risk growth strategy
Historically, the portfolio produced a total gain of 1116% during the displayed period. Its largest peak-to-trough decline during that period was 50.62%.
On a $10,000 account, a 50.62% decline would represent a temporary reduction of approximately $5,062 from a previous account peak.
Figures shown reflect the displayed historical period. Returns, declines, fees, and eligibility vary. This comparison is for information only and is not an investment recommendation.
Verified results for each automated trading portfolio. Figures below reflect the displayed historical period.
Historically, the portfolio produced a total gain of 40.77% during the displayed period. Its largest peak-to-trough decline during that period was 15.81%.
On a $10,000 account, a 15.81% decline would represent a temporary reduction of approximately $1,581 from a previous account peak.
ATM Portfolio 1 — Conserving Capital
Illustrative only — not a forecast or guarantee
Selected scenario detail
Projected value · 3.20% monthly return
This calculator is illustrative only. It uses simplified monthly compounding and does not reflect fees, taxes, withdrawals, changing market conditions, or the timing of drawdowns. Past performance does not guarantee future results. A SAMA representative can explain how fees and eligibility apply to your situation.

by Our Technology Partner, Prosperity Algo.


These videos explain strategy mechanics and are published under the Prosperity Algo brand.
Move at your own pace—from understanding the process to speaking with SAMA or beginning onboarding.
Start the onboarding path that fits your account structure.
Begin onboardingSpeak with SAMA about eligibility.
Book an introductionAccess your portfolio and account through the investor portal.
Investor login